A Peek Behind Genshin Impact’s $4B+ in Mobile Sales
A deep dive into how and where the massively profitable mobile game makes its money

Genshin Impact has taken the gaming world by storm since its release in September 2020, and one of these reasons, among many, is just how much revenue it has been generating. Shortly after launch, it became the fastest game to break $1 billion on mobile, achieving it in less than six months. News sites eagerly catered to the public’s fascination, reporting that Genshin Impact surpassed $2, $3, and then $4 billion in mobile sales. All this without factoring in the PC and PlayStation sales!
Genshin’s own community is equally fascinated by the statistics. Actual data around Genshin Impact’s revenue are unknown, as its publisher HoYoverse is a rather private company, but that hasn’t stopped the community from estimating sales and speculating on financial performance as well as theorizing reasons for each banner’s successes or “failures.” I, too, was curious about Genshin’s financial success, so I pulled all known datasets to run my own analysis on the game’s finances in an attempt to unveil a little bit of the magic.
Data Limitations
It is important to note that the data used in this post is based on rough estimates covering only two regions and their mobile sales – China and Japan. Due to a likely “garbage in, garbage out” situation regarding these limitations, all takeaways and insights are purely speculations for entertainment purposes.
For this analysis, China iOS data was pulled from Genshin Lab, and Japan iOS+Google Play data from Game-i. As a result, note the following:
- All numbers are estimates and not actual data.
- Only China iOS and Japan iOS+Google Play mobile sales are analyzed. China’s Android market and all other geographies are not included.
- PC, PlayStation, and third parties (e.g., Codashop) are not included.
- China’s data is of unknown conversion rate. Japan market data uses the JPY/USD conversion rate as of March 27, 2023.
- Dataset is through the end of Nahida & Nilou’s banner (May 2, 2023).
Data Analysis
I start with a top-down view of Genshin’s mobile total sales since launch (section 1). Then I break out sales by banner (sec. 2) and by geography (sec. 3), and then lastly, I will take a look at the comparison of single vs. double banner offerings (sec. 4).
All charts are available at higher resolution here.
1. Total Sales
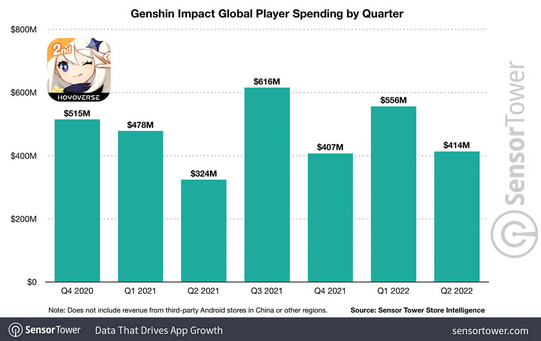
Market intelligence firm SensorTower has estimated Genshin’s global mobile sales, shown below. However, their most recent publicly available estimate was only through Q2 2022 and is not further segmented, so few real insights can be drawn with just Figure 1.1.
So using the community’s data, I annualized Genshin’s sales across its 4 years of operation, assuming 18 banners per year.
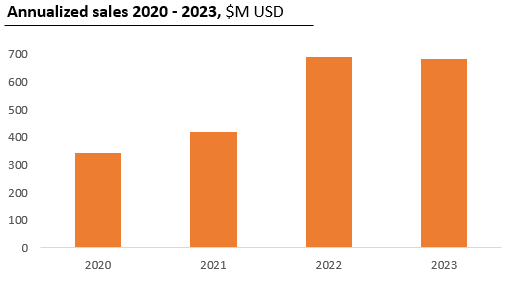
The annualized data shows steady growth from 2020 to 2022, and then maintenance of 2022’s strong performance in 2023. The remarkable >50% revenue increase from 2021 to 2022 was likely the “hockey stick growth” period, and the flattening in 2023 suggests that this may be Genshin’s steady state and that the explosive growth is over. Perhaps it was in anticipation of this slowdown that HoYoverse developed and released this year's Honkai: Star Rail, another AAA-quality gacha game featuring turned-based combat. Growth now means having to search outside of Genshin.
Just because growth has slowed does not mean that Genshin is even close to “dead.” Genshin is earning $700M in annual sales just from the mobile markets of two countries, which is a very high profit margin according to miHoYo’s own estimate of $200M per year in maintenance costs.
2023’s revenue may also ultimately outperform my estimate, as the small dataset we have so far overly weighs the low performance of the controversial Dehya & Cyno banner. This highlights an important dynamic, which is that as a gacha Genshin’s sales are driven more by its character banners than by seasonal forces.
2. Sales by Banner
When cut by banner, sales fluctuations start to make more sense.
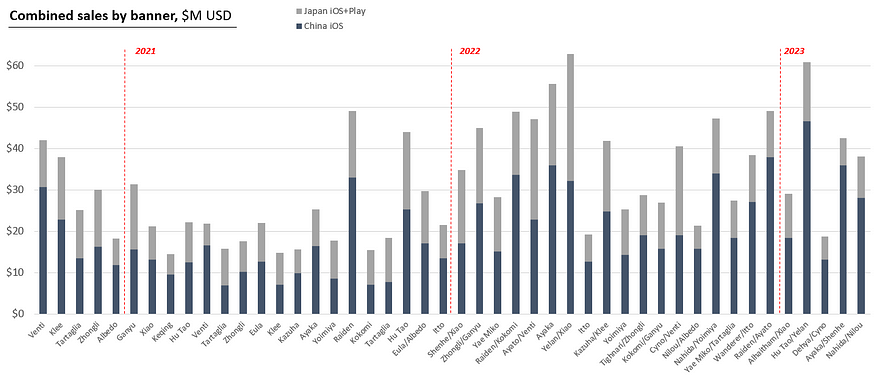
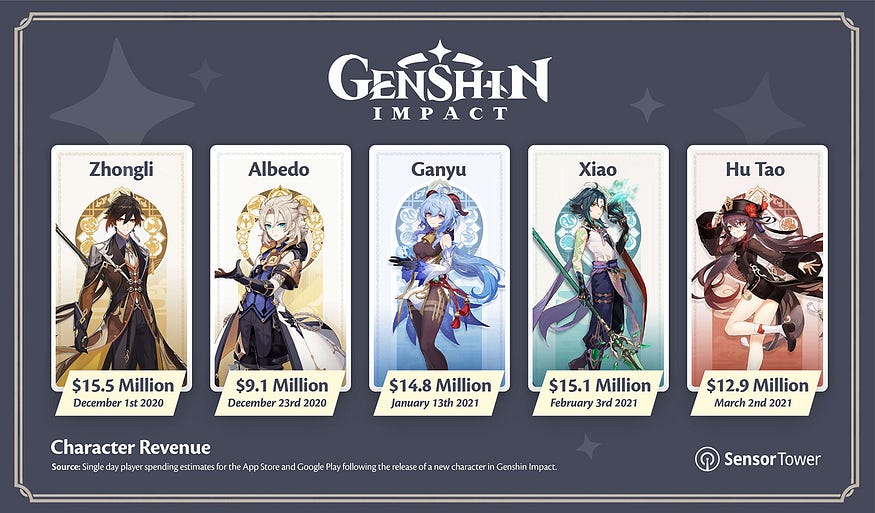
Q3 2021's spike in SensorTower’s data (Fig. 1.1) is likely single-handedly driven by Raiden Shogun’s banner, a blockbuster event after a slow start to the year. And while 2021 saw a couple more hits afterward, 2022 was able to consistently repeat the magic.
Multiple high-performing banners and steady growth (Fig. 2.2) resulted in the hockey stick growth in 2022. Notably, Yelan’s debut banner in mid-2022 was equally a smashing success in China and Japan, helping it become the highest-grossing banner in our dataset.
Community discussions on banner performance often reference GenshinLab’s data because it is the more accessible site, but this results in a China-centric view. As we see here, banners resonate differently between markets in China and Japan, so let’s take a deeper dive into geographic segmentation.
3. Sales by Geography
When comparing Genshin’s sales in China and Japan’s mobile markets, China is clearly the bigger market compared to Japan. China’s sales just from the Apple App Store are greater than Japan’s combined iOS and Android sales.
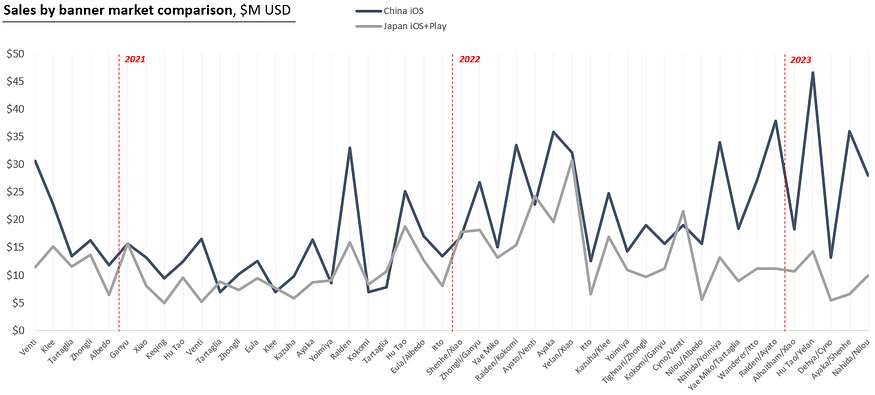
The mobile sales gap widens starting in Q4 2022 with Nilou’s banner. Perhaps this is correlated with Genshin’s increased promotion of the new element Dendro and its play style. Again, the limits of our dataset make it difficult to draw any real insights into geographic variations.
3a. Gaming on PlayStation and PC vs. Mobile
Without sales data for PlayStation and PC, we cannot ascertain whether Genshin in Japan is actually declining, both in sales and as a share of the revenue.
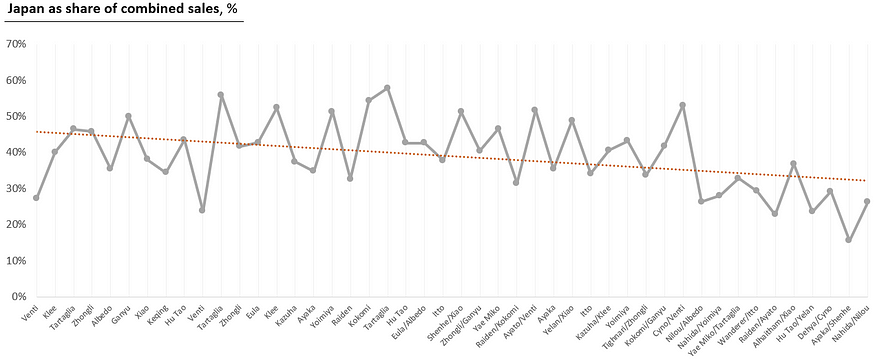
I think it is likely that the player base in Japan migrated to the other platforms as combat mechanics deepened, especially given the higher ownership rates in Japan of both a smartphone and either a gaming PC or PlayStation. The adoption of PlayStation is significantly higher in Japan, where gaming consoles are embedded in its modern culture. China, on the other hand, had levied a 15-year ban on game consoles. The adoption of home gaming PCs has also skyrocketed in Japan in the past 3 years.
3b. Character Preference by Geography
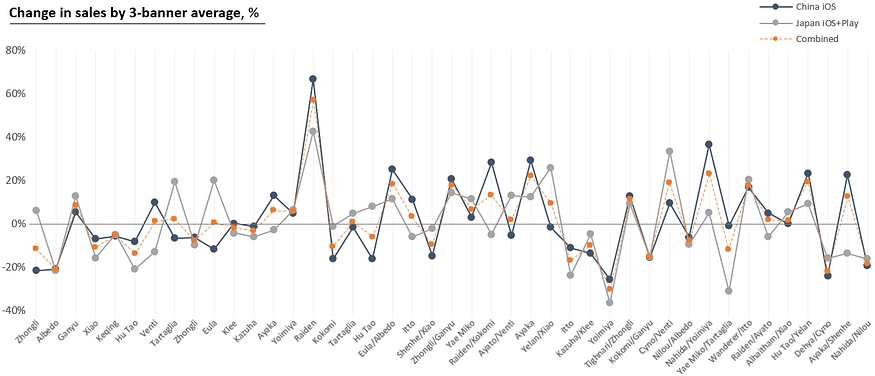
Top of mind for any company selling to different countries is the potential variance in cultural preferences. For a gacha game, this could be the reason for differences in relative performance by banner. Similarities, on the other hand, would be driven by universal factors, such as positive story portrayal of a character and how much gameplay motivates consumer spending (i.e., the “waifu/husbando” vs. meta debate).
Figure 3.1 indeed shows us a high level of association between China and Japan’s mobile markets. Banners that do well in one country tend to also do well in the other (and vice versa), suggesting a strong degree of influence from the more universal factors mentioned above. But the association is not perfect, which suggests that regional preferences also play a role.

For example, Raiden and Hu Tao banners tend to be more successful in China, while the Japanese market particularly liked Ganyu, Shenhe, and Cyno’s debut banners. Even more interestingly, the back-to-back Ayato and Ayaka banners in early 2022 saw reversed receptions between the two markets: sales in China dipped for Ayato’s debut while Japan saw a spike, and then for Ayaka’s banner, sales rose back up in China while it dropped in Japan.
We can only speculate as to why certain characters resonate with some countries’ markets while others do less so. Given the differences between just the Japanese and Chinese markets, it would be even more interesting if we were able to see sales data across all markets and understand how gamers around the world are receiving Genshin’s cast of characters.
4. Sales by Double vs. Single Banner

Rumors have started swirling in the community about whether we will eventually see triple banners, I became curious about the question of single vs. double banners. Do double banners earn double that of single banners because they offer two characters, or do they end up competing with each other for the same spending customers? An initial crunch of the numbers shows the following:
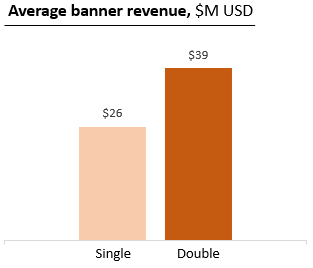
At first glance, double banners seem to be significantly higher grossing than single banners, increasing sales by ~50% on average! But there are caveats; double banners were implemented in late 2021, when Genshin’s player base had already grown massively. Sales were already higher than they were a year before, so naturally, double banners would be set up with a sales advantage over single banners.
To control for this, I switched to just examining the transition period when banners were alternating between single and double. This was from November 2021, with Hu Tao’s 1st re-run, until August 2022, with Tighnari & Zhongli’s double banner.
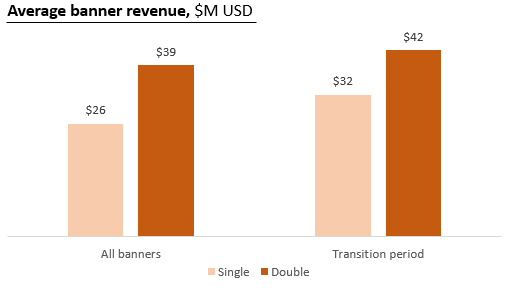
We can see that even when the game lifecycle is controlled for, double banners still significantly outperform single banners, at about 30% higher in sales. This is despite a COVID-induced delay during this time period that prolonged a single banner and shortened a double banner, so the bump from offering double banners may be even higher.
In summary, the answer to my question is “somewhere in the middle.” Offering two characters at once instead of one resulted in a net ~30% increase in sales. There was not a total cannibalization between the two banners, but there was also not a 100% increase or doubling of sales. This suggests diminishing returns as more concurrent banners are added. This means that if triple banners are implemented in the future, we should expect average banner sales to show a net increase again, but it would be a small increase of less than 30%. And if we go further to a potential future quadruple banner, the net sales increase may be negligible, if there is one at all.
In Conclusion
Now that Honkai: Star Rail has launched, I expect gamers, industry insiders, and HoYoverse investors alike to be closely watching the game’s financial performance. As the first game released by HoYoverse after Genshin Impact, it is expected to build upon all the resources, experience, and lessons learned by Genshin. In fact, GenshinLab, who provided the China iOS data for this post, has already set up a China iOS sales tracker for it.
In the meantime, Genshin Impact’s financial performance will remain a fascinating subject for its community as the world of Teyvat continues to evolve and expand, and only time will tell how its younger brother performs against it.
Join the conversation
What do you think? Reply below to share your perspective.